Reading QR code data: how to analyze one code and a whole batch
Settle what you are analyzing and how the numbers are counted before reading trends — and why scans are not people and unique visitors cannot simply be added up.

Key takeaways
- A single code answers how one entry point performs; a batch answers how a group of related entry points perform together.
- Align the time range, time zone, filters and event definitions before comparing anything.
- When there is not enough data to support a figure, mark it unavailable rather than filling in zero or extrapolating.
What misleads people most in analytics is that the more precise a number looks, the more reliable the conclusion seems. In practice, working out whose data it is and how the number was produced matters more than whether the trend line points up. One QR code, one batch of campaign codes and a whole workspace answer different questions, and they should not be mixed up without knowing it.
This article offers a way to read QRHub’s per-code and per-batch analytics. Every figure below is a worked example, not live operating data from the platform and not the real performance of any business.
01 Choose the object before you choose the chart
Per-code analytics looks at one specific QR code ID, which suits a single poster, one store’s table card or one product guide entry point. Batch analytics looks at a group of codes that share a task origin, which suits comparing one campaign round, one production run or one CSV import. A folder can change where something is filed; a batch identity should stay traceable.
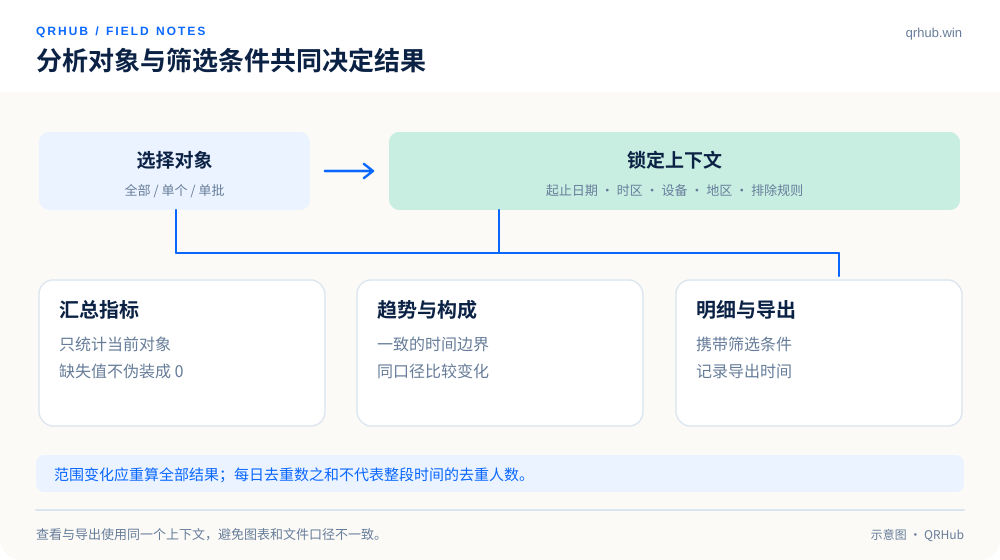
Once you are in the analytics view, first confirm that the object name, the scope, the time and the time zone are all on screen at once. An export should carry the same conditions. Otherwise you look at one store in the dashboard and download the whole workspace, and however accurate the numbers are, they cannot be used for a review.
| Scope | The typical question | The identity to check first |
|---|---|---|
| One QR code | Is this table card still being used? | qr_id, destination, placement |
| One batch of QR codes | Which entry points in this round behave differently? | batch_id, member list, placement dates |
| The whole workspace | How do maintenance and usage trend overall? | workspace boundary, member permissions, exclusions |
02 Scans, visits and people are not synonyms
Many dynamic code services log requests at the managed redirect entry point, so the “scans” shown are usually an event count. A camera recognizing the pattern without the person opening the link may leave no redirect request at all, while one person opening it several times may leave several events. Browser previews, security checks and bot requests can all affect the raw log.
None of that is an argument against counting; it is a reminder to read the definition first. If the product says “redirect requests after rule-based filtering”, do not restate that as “people who came in”. And without a form, an order or another business event to join to, scans cannot stand in for sales.
A static code is not entirely blind to what happens next either: the destination site can measure its own visits. But if several printed codes encode exactly the same address, that address alone usually cannot tell you which piece of material produced a visit. If you need to tell sources apart, design distinguishable entry points or parameters before you place them rather than guessing afterwards.
03 Add up what can be added; deduplicate what cannot
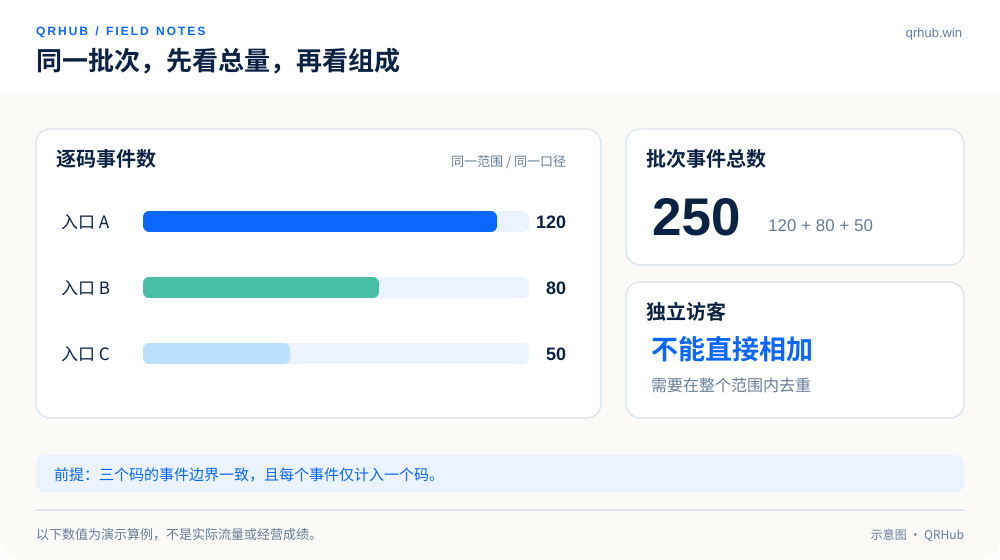
Suppose three codes, A, B and C, in one batch produce 120, 80 and 50 events under the same definition and each event belongs to only one code. The batch total can then be added up as 250. That addition depends on the event boundaries being clear and nothing being counted twice.
Unique visitors are a different matter. Someone who scanned A and also scanned B appears in both visitor sets. Adding A’s 60 people to B’s 45 does not prove there are 105 distinct people. In the same way, adding up daily unique visitors usually does not give you the monthly unique visitors. This is the difference between the union of two sets and overlapping elements, not a limitation of any particular chart.
If the system genuinely cannot identify visitors, or privacy settings do not allow the necessary linkage, show “unavailable” and say why. Not collecting something is not the same as zero visitors, and being unable to deduplicate does not mean scans should be passed off as people.
04 Align the conditions before you compare
Two people pick “September” (month 9) in two different time zones, and events near the boundary can land on different dates. When comparing two entry points, use the same time zone, the same start and end boundaries, the same device and country filters and the same rule for excluding test traffic. A code that went live two days ago and one that has run all month cannot be judged by comparing their totals either.
You can look at the dates they have in common, then at the trend per day actually in service; that still does not mean foot traffic and material exposure are accounted for. Analytics is good at raising the next question to check, and it should not be left to prove causation on your behalf.
When you add UTM parameters to campaign sources, standardize capitalization and naming as well. Google’s documentation uses parameters such as source, medium and campaign to tag where a campaign came from; to see the resulting data, the destination end still has to be able to collect and report it.[1]
05 Keep the history explainable
If a code inside a batch is paused, moved or deleted, it should be clear whether its past events still count. Deleting a record today should not silently change yesterday’s total. Long-running projects can keep soft-deleted records or membership snapshots and distinguish “current members” from “members during the period”. That is a suggested design convention, not a claim about how every platform works today.
Empty states deserve separating too: genuinely no events, reporting not yet started, data delayed, object does not exist and insufficient permission should each say something different. Recording the filter conditions and the generation time on an export saves colleagues from repeatedly working out why your numbers differ from theirs.
06 Start from an anomaly, not from a conclusion
When one store’s entry point drops suddenly, first check whether the table card was replaced, the destination changed, opening hours shortened or reporting interrupted. When a batch jumps upward, first check for internal testing, crawlers or repeat requests. Settle the data quality before discussing content and placement.
A useful review can be short: what we observed, what we ruled out, what we still do not know, what to check next. That kind of note becomes a repeatable method far more easily than announcing success off one rising curve.
Sources and further reading
- Google Analytics, naming campaign URLs and UTM parameters. https://support.google.com/analytics/answer/10917952?hl=en
Related reading